Creating a DSM
With a directory of classified las files, a DSM can now be generated. A DSM represents the top surface elevation, which could be trees or buildings. LiDAR data can contain outliers, points reflecting off birds or other obstructions, therefore it is recommended to filter the data. In this case any points that deivate more than 2.5 standard deviations from the local mean, were collected at greater than 20 degree off-nadir, and points greater than 400m are filtered out.
$ l2d_dems dsm lasclass/ -s features.shp --outdir dems --maxsd 2.5 --maxz 400 --maxangle 20 --gapfill
This will create a single set of DSM files, one for each polygon in the site file. DSM pixels are populated with the maximum elevation return within each cell (using the default radius of 0.56). A set of density images (.den.tif) and maximum images (.max.tif) will be made.
$ ls dems/features*dsm*r0.56*
features-0_dsm_r0.56.den.tif   features-14_dsm_r0.56.den.tif  features-1_dsm_r0.56.den.tif  features-6_dsm_r0.56.den.tif
features-0_dsm_r0.56.max.tif   features-14_dsm_r0.56.max.tif  features-1_dsm_r0.56.max.tif  features-6_dsm_r0.56.max.tif
features-10_dsm_r0.56.den.tif  features-15_dsm_r0.56.den.tif  features-2_dsm_r0.56.den.tif  features-7_dsm_r0.56.den.tif
features-10_dsm_r0.56.max.tif  features-15_dsm_r0.56.max.tif  features-2_dsm_r0.56.max.tif  features-7_dsm_r0.56.max.tif
features-11_dsm_r0.56.den.tif  features-16_dsm_r0.56.den.tif  features-3_dsm_r0.56.den.tif  features-8_dsm_r0.56.den.tif
features-11_dsm_r0.56.max.tif  features-16_dsm_r0.56.max.tif  features-3_dsm_r0.56.max.tif  features-8_dsm_r0.56.max.tif
features-12_dsm_r0.56.den.tif  features-17_dsm_r0.56.den.tif  features-4_dsm_r0.56.den.tif  features-9_dsm_r0.56.den.tif
features-12_dsm_r0.56.max.tif  features-17_dsm_r0.56.max.tif  features-4_dsm_r0.56.max.tif  features-9_dsm_r0.56.max.tif
features-13_dsm_r0.56.den.tif  features-18_dsm_r0.56.den.tif  features-5_dsm_r0.56.den.tif
features-13_dsm_r0.56.max.tif  features-18_dsm_r0.56.max.tif  features-5_dsm_r0.56.max.tif
Because the –gapfill switch was provided, in addition to the set of images for the polygons, a gapfilled version for each polygon will be created. Point density images are never gapfilled.
$ ls features*dsm.*
features-0_dsm.max.tif   features-13_dsm.max.tif  features-17_dsm.max.tif  features-3_dsm.max.tif  features-7_dsm.max.tif
features-10_dsm.max.tif  features-14_dsm.max.tif  features-18_dsm.max.tif  features-4_dsm.max.tif  features-8_dsm.max.tif
features-11_dsm.max.tif  features-15_dsm.max.tif  features-1_dsm.max.tif   features-5_dsm.max.tif  features-9_dsm.max.tif
features-12_dsm.max.tif  features-16_dsm.max.tif  features-2_dsm.max.tif   features-6_dsm.max.tif
Finally, l2d_dems will create a merged VRT file using all of the individual polygons for both the maximum and the density products, which can then be viewed in QGIS or any other GIS program that supports GDAL file formats.
$ ls dems/dsm*
dsm.den.vrt  dsm.max.vrt
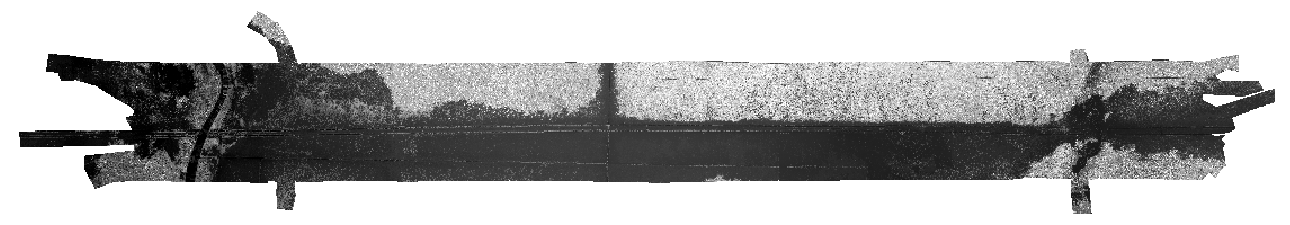
####Density image
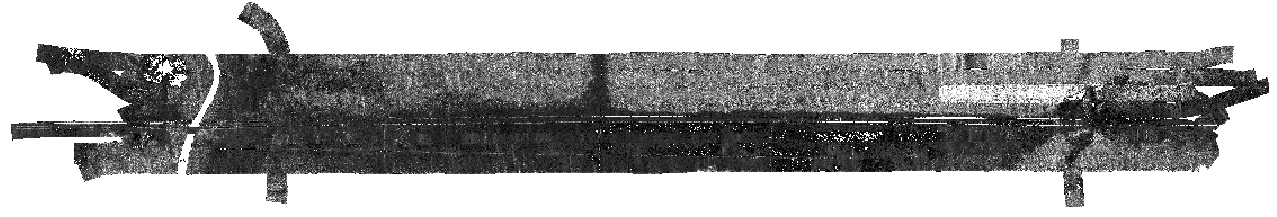
####DSM image