Exploring Point Clouds
The initial dataset most often consists of a series of unclassified LAS files within a single contiguous region. This may be a single LAS file for small areas, or more commonly, a series of swaths correponding with the flight lines of the aircraft or non-overlapping tiles if the swaths were merged together and broken into manageable pieces.
Data Summary
Prior to performing any procesing it is often desirable to examine the data to ensure it is readable, contains the expected fields (dimensions) and meets or exceeds the expected point density (e.g., points/m^2). The pdal info command can be used to output a summary of the dataset:
$ pdal info filename.las --summary
which will output a summary of the dataset as JSON:
{
  "filename": "230500-9754000.las",
  "pdal_version": "PDAL 1.0.0.b1 (d281c0) with GeoTIFF 1.4.0 GDAL 1.11.1 LASzip 2.2.0",
  "summary":
  {
    "bounds":
    {
      "X":
      {
        "max": 230999.98999999999,
        "min": 230500
      },
      "Y":
      {
        "max": 9754499.9900000002,
        "min": 9754000
      },
      "Z":
      {
        "max": 541.26999999999998,
        "min": 7.3399999999999999
      }
    },
    "dimensions": "X, Y, Z, Intensity, ReturnNumber, NumberOfReturns, ScanDirectionFlag, EdgeOfFlightLine, Classification, ScanAngleRank, UserData, PointSourceId",
    "num_points": 5871066,
    "spatial_reference": ""
  }
}
It is common for LiDAR data to not contain metadata for the Spatial Reference System (SRS), and in fact lidar2dems assumes it is not available within the dataset itself. The SRS is provided by the user via the site shapefile. The bounds given by pdal info is the bounding box of the data, and thus a rectangle rather than a polygon which more specifically describes the region of the data. As such, the bounds are of limited use since they do not indicate where there might be nodata regions in the data.
Depending on the version of the LAS file specification used, there are several commonly used dimensions:
- X, Y, Z - These are the actual coordinates of the point in 3d space.
- ReturnNumber and NumberOfReturns: Photons from a single pulse from the LiDAR instrument can be reflected off several objects, and the instrument records the strongest signals as individual ‘returns’. Each point stores how many returns were recorded from that specific pulse, as well as the return number of that point. Single return LiDAR instruments only record the initial return, while up to 4 returns are often seen in multiple return LiDAR.
- Classification: The LAS file specification uses a common classification scheme of integers from 0 to 12. Classifications will vary between data sets, but generally coding of return classes will be consistent between classifier programs. PDAL ground is limited in that it only classifies points as ground and leaves all other points unclassified. As such, 0 indicates the point has never been classified and as is most common, ground classified returns are coded with 2. There are circumstances where this may not be the case with pre-classified data, so be sure to refer to metadata for your dataset. Other classifying software uses classes higher than 2 for special surface types, but are not used by lidar2dems. lidar2dems assumes the classification scheme used follows the convention where 2 is a ground point, and all other integers are non-ground points.
- ScanAngleRank - This is the angle off nadir for the point, in degrees, truncated to an integer. Most often in the range of -20 to 20 degrees.
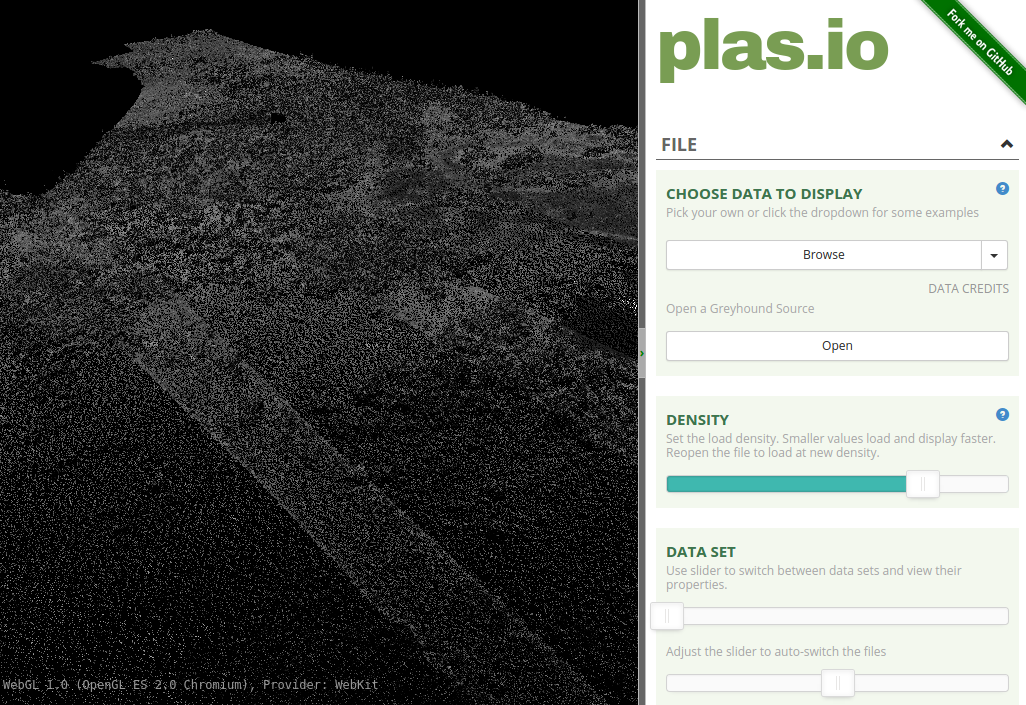
Visualization
It can be interesting and useful to look at a 3d visualization of the point cloud. While there are some offline GUI tools to do so, the easiest way we have found is to use the online point cloud visualization tool plas.io. The tool is self-explanatory, and is capable of visualizing even large point clouds. It can be useful for an initial inspection of LiDAR data, to see if there are any potential problems reading, or visible errors within the data.
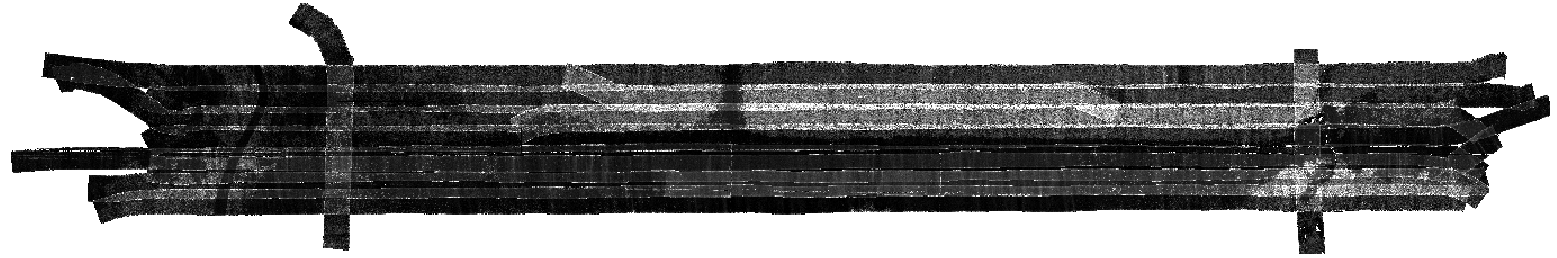
Also useful is the ability to look at an image of the point density in terms of points/m^2. The ‘l2d_dems density’ command is used to generate point density images from unclassified or classified LiDAR data. A good initial step is to create a density image of the data, then use that image in a GIS program where polygons can be drawn to select an area of interest that is completely covered with data.